Oh yeah, I have a blog! I should use that more!
I did a really cool and, I think, meaningful project with my Foundations of Math 11 class this year, one that I think is worth sharing. I teach grade 11/12 physics and math at a public school that emphasizes project-based, authentic, interdisciplinary learning, but the staff often find that making authentic connections to senior math content can be challenging. Math, at least at the grade 11/12 level, often gets left behind from what we are trying to do.
In Quarter 4 this year, I had a section of Foundations of Math 11, which, lucky me, is a little easier to find those connections with. I procrastinated a little more than I should have in getting ready for this course, so three days before the class started, I belatedly remembered the 2nd year mechanical engineering students at UBC doing a cardboard boat contest, and brazenly stole that idea. Over the course of our nine weeks, students would be designing, building, and testing life-sized cardboard boats.
Context
This was a weird class. For the first two weeks, the class was taught by a teacher candidate on his final practicum – due to timing weirdness, this was during the “phase out” two weeks of practicum, so I did most of the planning to prepare for takeover. This class was on the quarter system, so we were together for 3 hours per day for around 9 weeks. There were 7 students registered and the only reason it ran was because several of these students were grade 12s who needed the course to graduate. One of the students was a math superstar, had already taken Pre-Calculus 11, and was only there because he had heard me talking up the project in the halls and he just really loved boats. Four of the students had significant attendance issues throughout for a variety of reasons, some more valid than others. Around half the class were Indigenous, four students were girls, three were boys, two had IEPs, and all but the boat-loving fellow expressed high levels of math anxiety. The happy ending here is that every single person in that class made it through in the end, and they showed incredible self-awareness about their own growth over the course.
Project Stages
This project was not a short one-and-done. We started it on Day 4 and we finished it the last day of the course. Content and curricular competencies were threaded into the boats throughout. Briefly, here’s what we did:
Stage 1: Background
We started with a classic design challenge, making aluminium foil boats and seeing which held the most pennies before sinking. I then gave students a whole bunch of photos of boats, of all shapes, sizes, and purposes. Their job was to categorize the boats as they saw fit, then look at others’ categories. I asked the question, “if you wanted to build one of these boats, what would you need to know?”. This gave students an opportunity to influence what direction the project would go.
At this point, we also introduced students to the design cycle, using the Applied Design curricular competencies from the BC Applied Design, Skills, and Technology curriculum. This stage was a combination of Understanding Context and Defining.
Stage 2: Scale prototypes
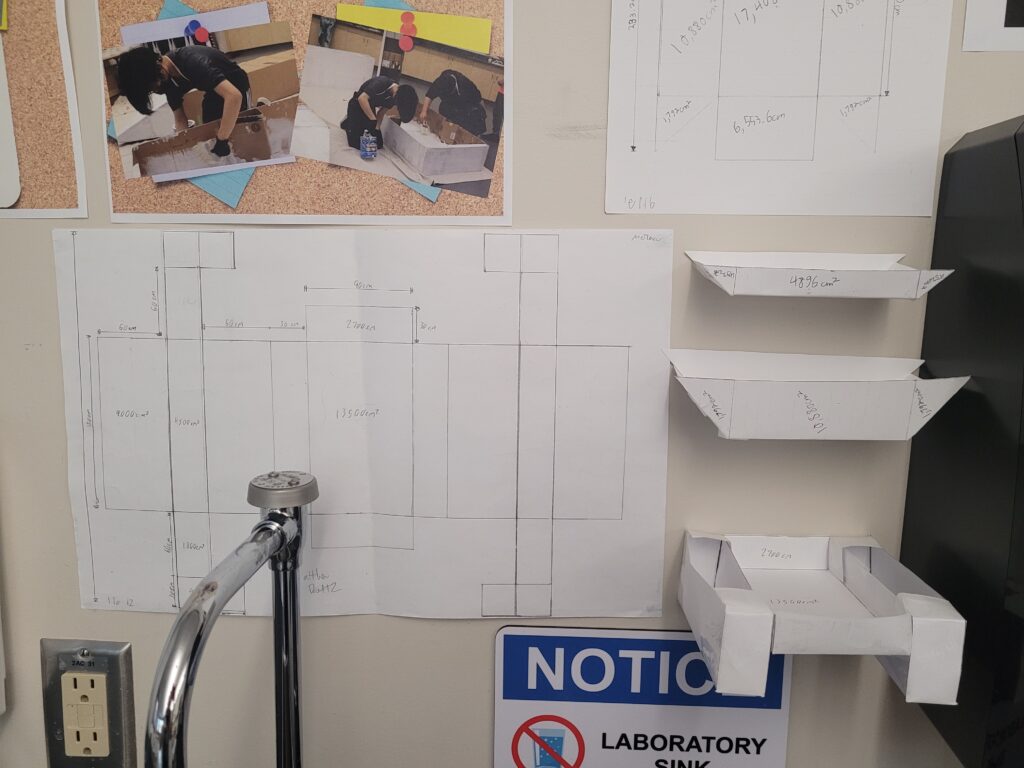
At this point, we had already started doing the scale models content of the curriculum and would move into angle relationships during this stage. Students created their first prototypes, nets of their boat designs, with some time for additional research on what makes boats float. Because these nets were also assessing their understanding of content, they were required to label the scale, linear measurements, area, and volume on their prototypes, as well as use a ruler (which you’d hope by grade 11 they would know, but clarity of expectations is always a good idea). Students would eventually create multiple prototypes, following the next stage: testing
Stage 3: Testing
As we moved into the Statistics unit, students had an opportunity to put statistics into practice by doing some light statistical analysis of the testing phase. I would note that I deliberately limited how much statistical analysis was required for testing due to this being my first time on this project. In the past, I have sometimes started projects with broad scope and had to scale back once I figured out how much time early components were taking, and this time, I wanted to make sure we got our boats out to the lake, so I started by scaling back in the planning stage.
Students determined themselves as a class which variables they were going to test, and we landed on how much weight the boat could hold before sinking, how fast the boat moved through water, the location of the centre of gravity, and how stable it was. For the first three, students built multiple copies of their prototype to conduct their tests a few times and find mean, median, and standard deviation values for their results (the last, stability, was a more qualitative analysis). Another teacher very kindly lent me a very long bin for costume storage to use as a tank for the speed test, as well as a very large fan to propel our boats. Weight was tested using my extensive collection of pennies. They were taught some basic features of Microsoft Excel to do their analysis with, and hopefully took away that this was a valuable tool for automating data analysis.
After conducting their tests, students completed a short reflection on how they would change their next prototype based on their results. They then made a new net and conducted the tests all over again. Students designed three scale prototypes in all. It was at this point in the course that one of my students announced that he had never been so motivated to learn math because it was connected to the real world.
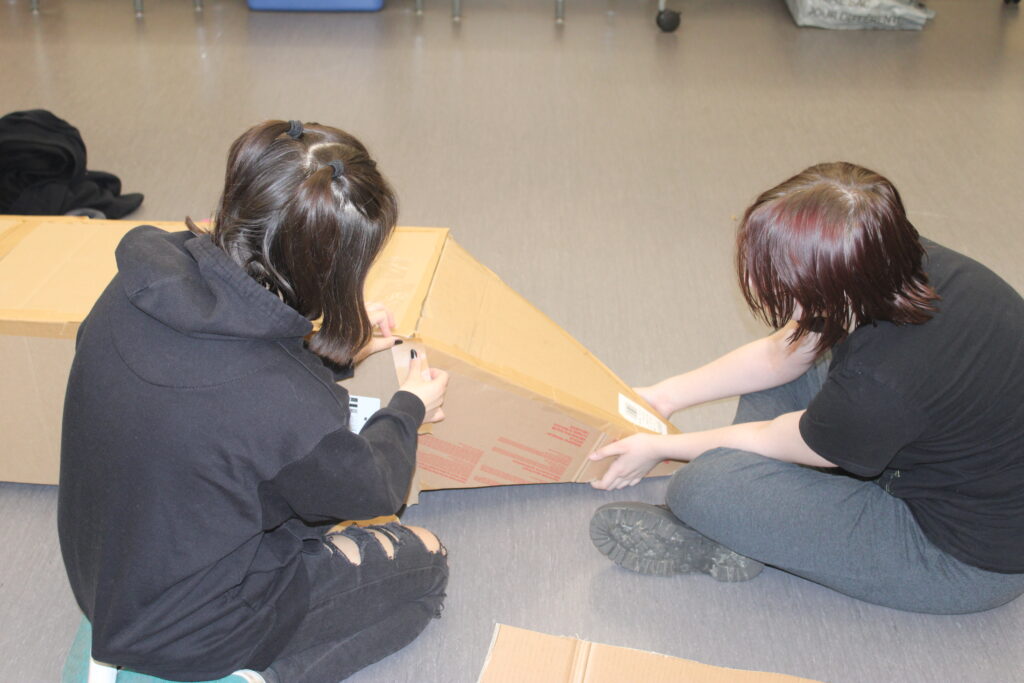
Stage 4: Production
Students split into groups of two or three and decided on one prototype between them that they were going to build full-sized to test at the lake. The boats were made of cardboard, assembled using paper tape, and waterproofed using roofing sealant, which was recommended by cardboard boat enthusiasts online. Students continued to lightly iterate on their designs during this phase, as they learned that additional stability was needed at full scale. We continued with other content in parallel to this stage that didn’t fit into the project, such as graphical analysis of quadratic functions.
Stage 5: Final test and reflection
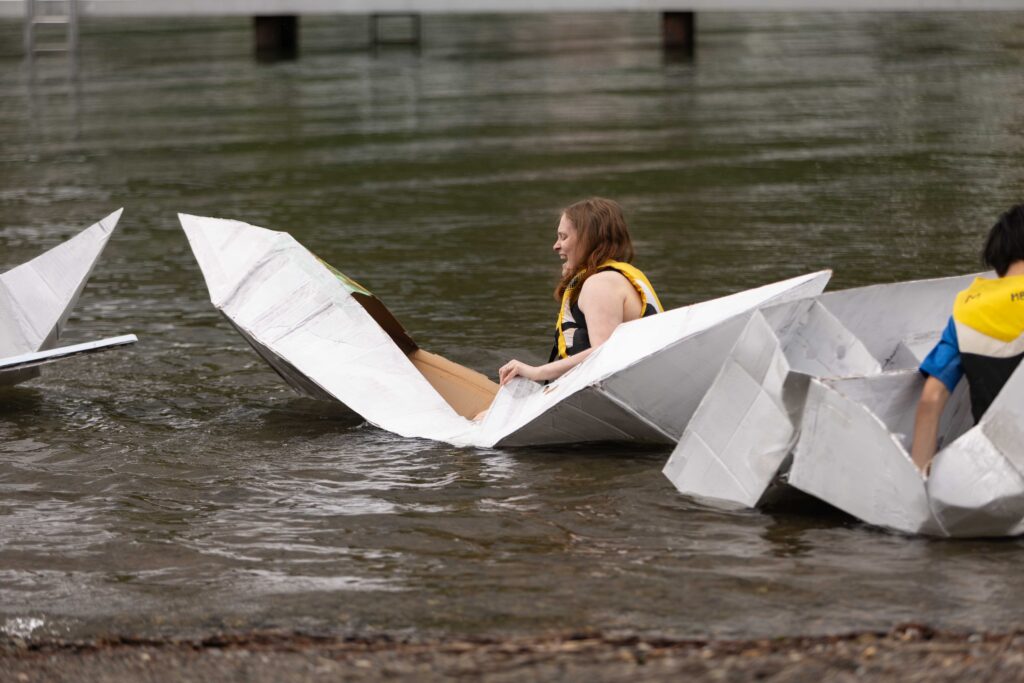
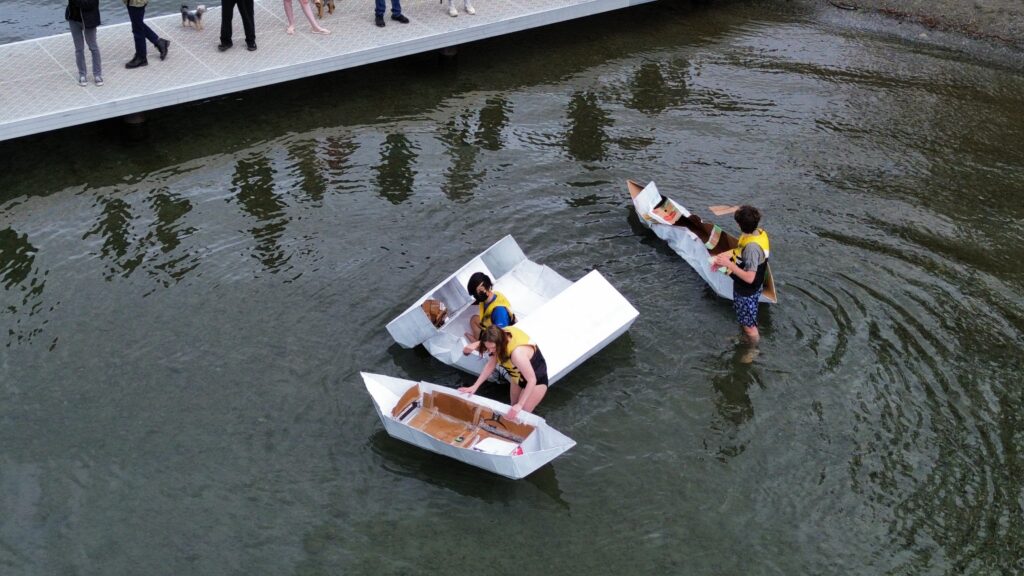
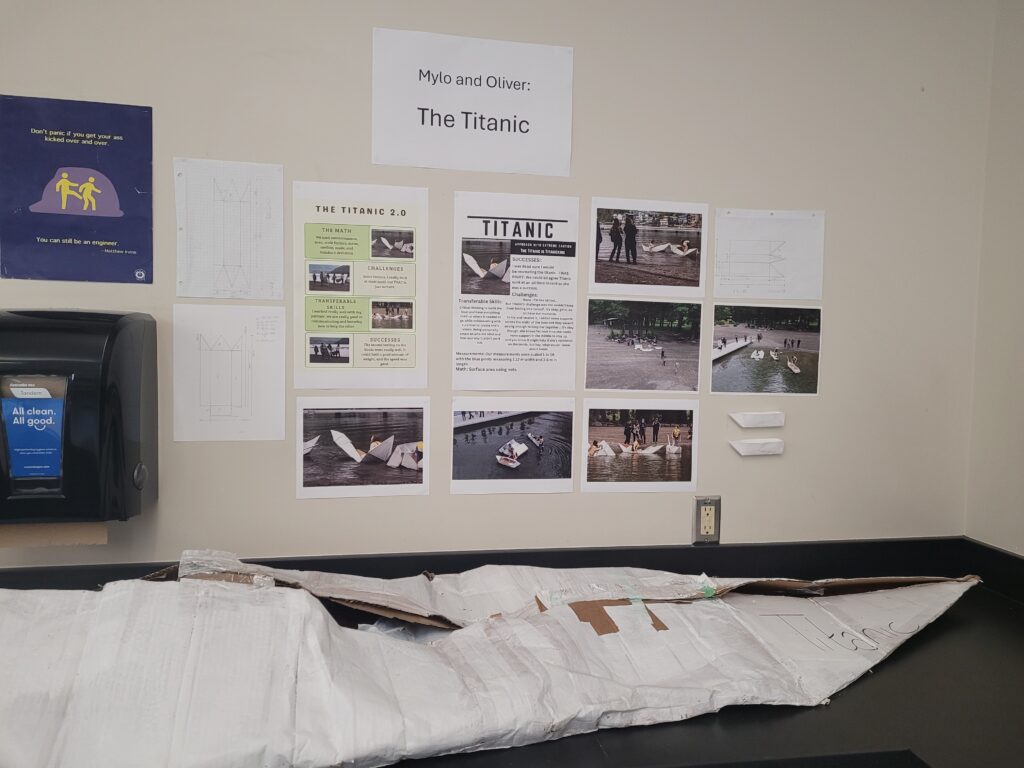
We went to beautiful Cultus Lake to test our boats! The photography class took the opportunity to join us and practice their photo story skills, and one student even brought a drone. Out of the three full-sized boats, one was successful (notably, made by two students who did not have attendance issues), but I think that we all had a good time and felt good about reaching the culmination of the process. There was much fun and hot chocolate had by all, whether in the boat or on the sidelines. Plus, everyone got to watch me get soaked as I tested one of the boats.
It was students’ final reflections when we got back that really made me proud, though.
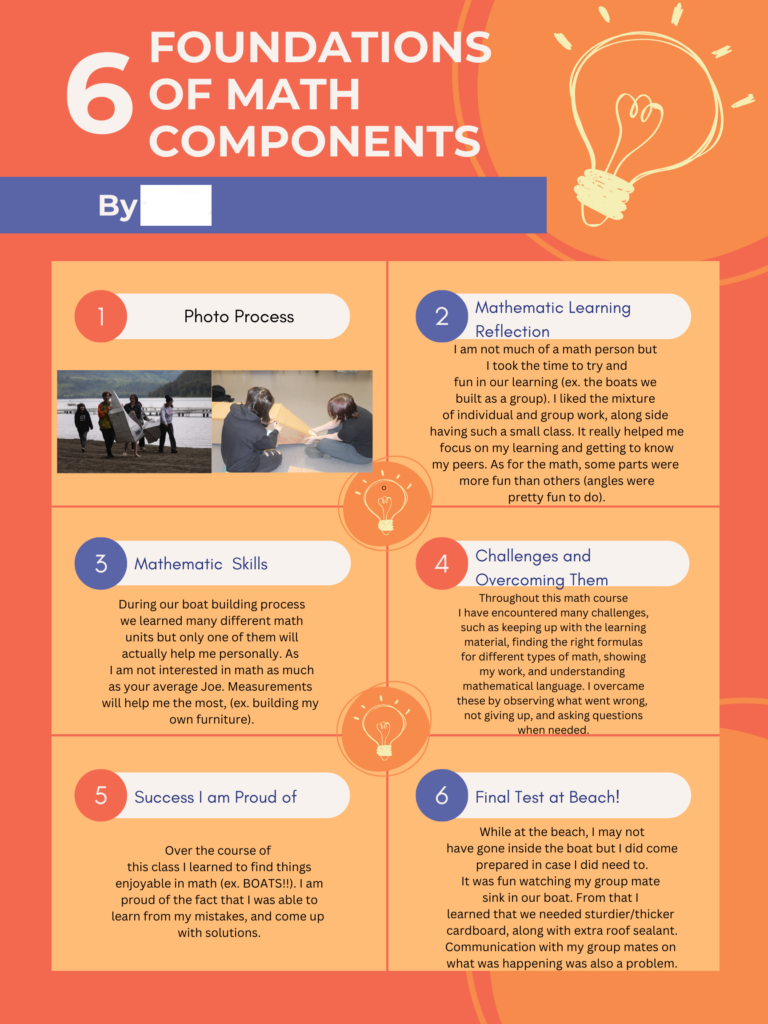
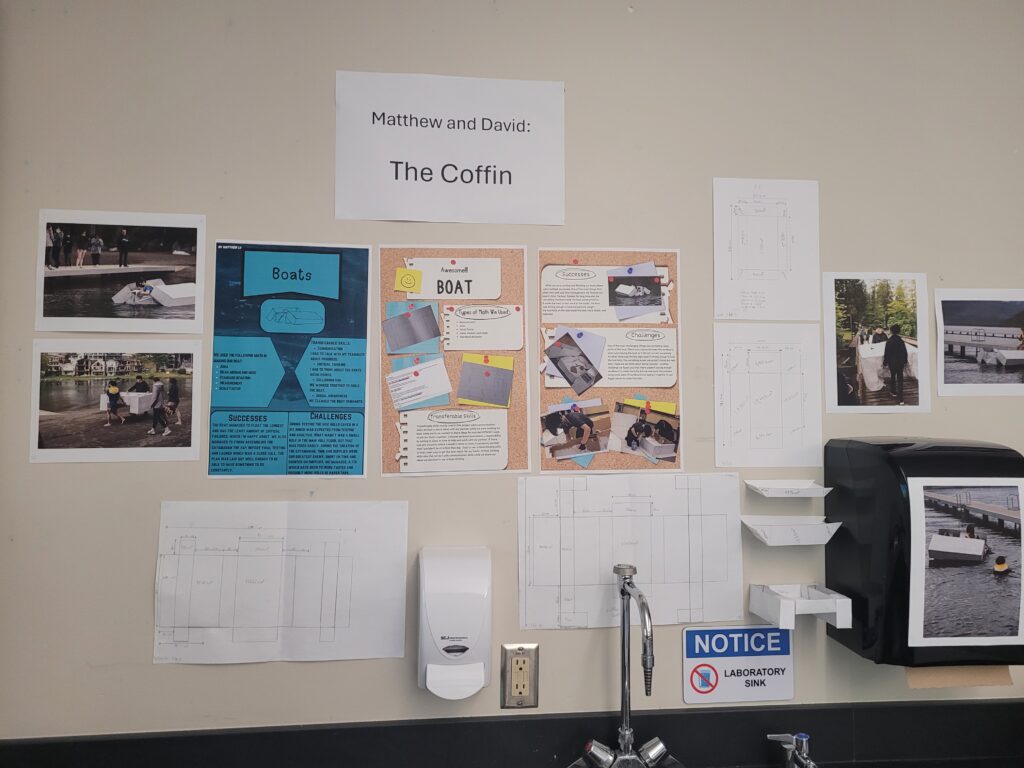
Students made some really positive observations about how they had grown over the course, both mathematically and as people. Given the amount of negativity most of these students had toward math, I was very proud of them for finding their strengths and being relatively positive about their weaknesses. Take the following poster. This student spent a good chunk of the course telling me and anyone else who would listen that she was intrinsically bad at math and was probably going to fail. She says in her reflection, “Over the course of this class I learned to find things enjoyable in math (ex. BOATS!!). I am proud of the fact that I was able to learn from my mistakes, and come up with solutions.”
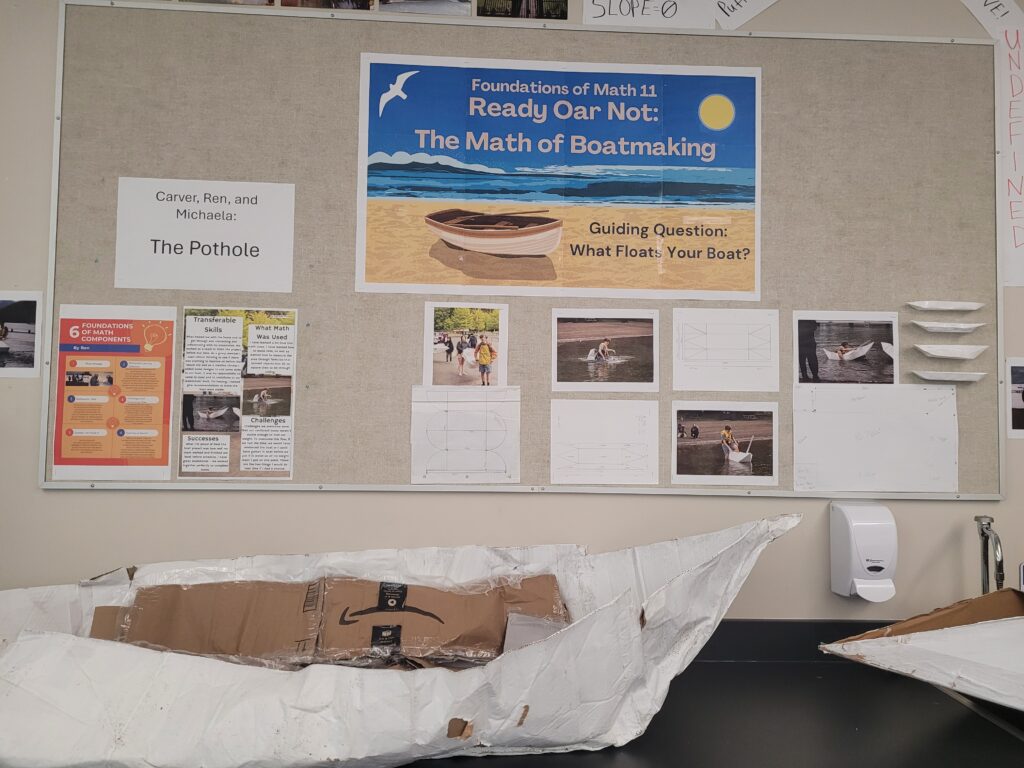
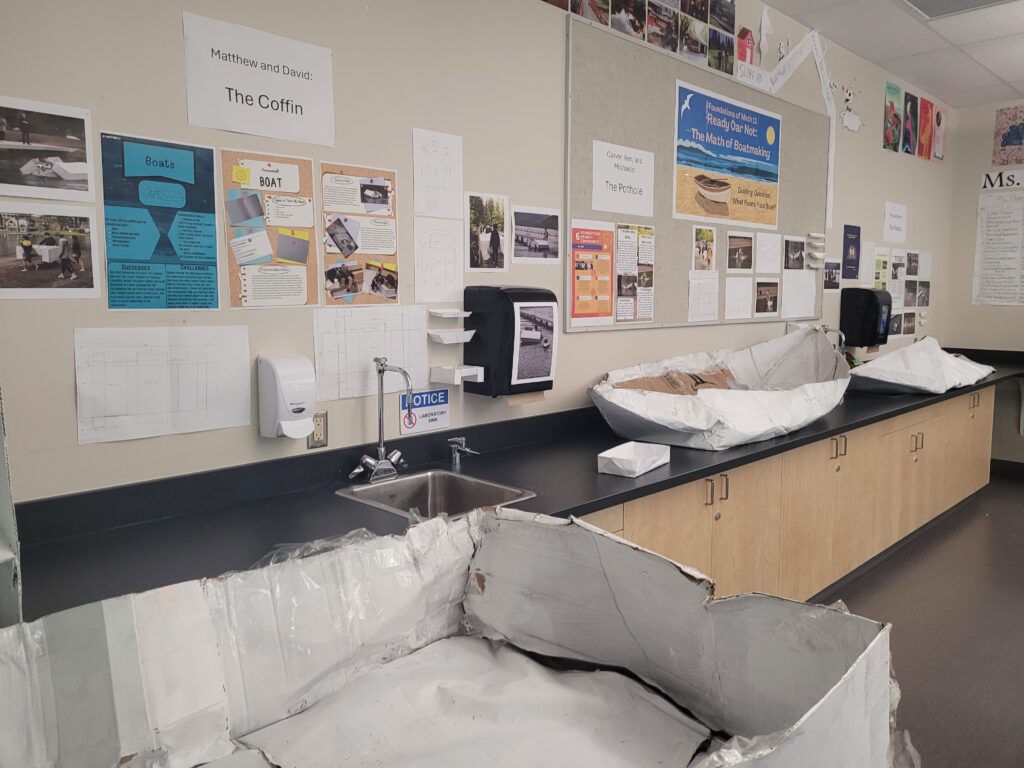
The last thing we did as a team was present our learning publicly, shipwrecks and all, at the school Exhibition of Learning in June.
Conclusion
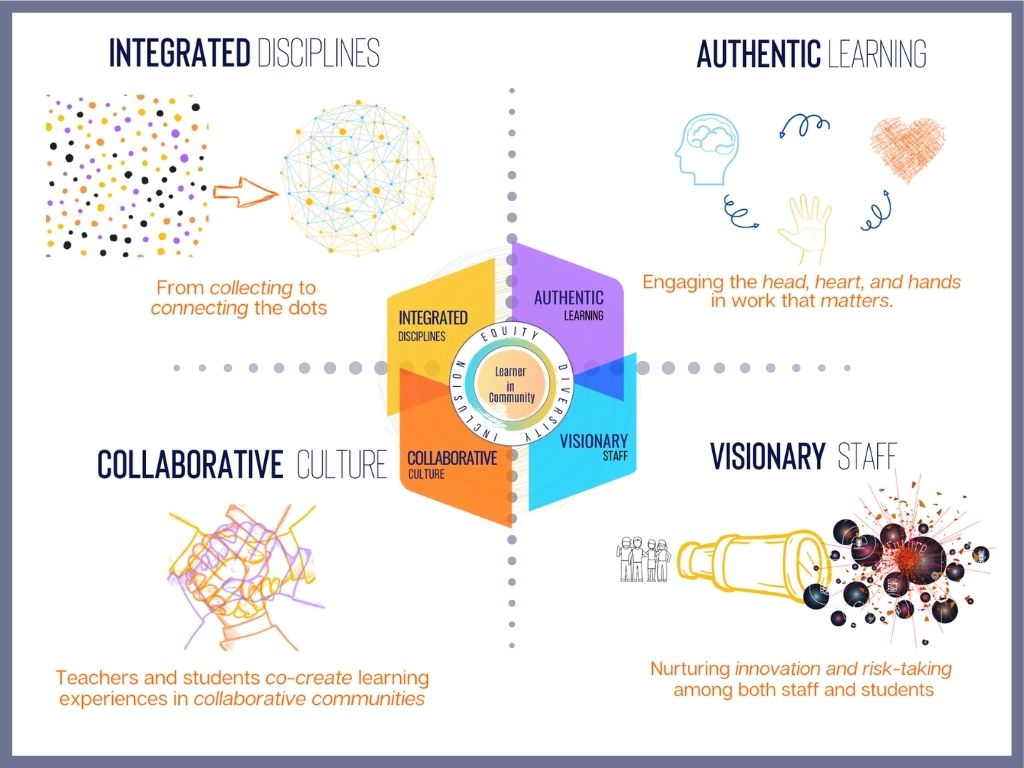
This project was put together fairly last-minute, but I feel very good about how much students learned and retained through the process, as well as how it influenced their self-efficacy in math. I loved seeing students who didn’t believe they were “math people” engage with the material and feel successful. I loved seeing them take ownership for their learning. I loved seeing them shift from seeing failure as a consequence of their own incompetence to an opportunity for growth. I loved how nobody was worried that their final boats didn’t work as well as they’d hoped, because the entire process was a testament to their mathematical skill and growth. I loved how their reflections connected to the Core Competencies so beautifully. This project hit on all of our school pillars: it was a authentic experience, it integrated multiple subject areas, and it was collaborative, with parts of the experience co-created by students.
That all being said, there were absolutely things that I would change on a second run-through. I deliberately scaled down the statistical analysis for this group, and I feel that there are more in-depth connections that could be made there if I spent more time planning for it. The initial Understanding Context and Defining stages were pretty abbreviated and we didn’t go into the physics of buoyancy at all – with a stronger understanding of the physics, the final products may have gone better. During testing, one student was sick of remaking their prototype over and over again, and waterproofed it with tape – this is a great idea and I would recommend it to everyone next time. Time-permitting, it would be nice to do two cardboard prototypes and go to the lake to test twice – an unfortunate thing about going once is that there was no time to make improvements afterwards based on our experiences. This was my first time teaching Foundations at all, so I now have a better understanding of how long different topics might take and where common misunderstandings are.
I hope that this post makes other math teachers want to dip their toes into the cool waters of project-based learning. It’s not a perfect project, but it connected with a lot of kids who aren’t otherwise super interested in math, and the curricular connections were a natural fit. Whether you go full-on like I did or start smaller, you’re on your way to making math feel authentic for everyone.
купить аттестат россия